What is Website Monitoring? How It Goes Beyond Uptime
Did your last deploy break the pricing table? Is the contact form still working? Does that 301 redirect go where it should? Uptime monitoring only tells you the server responded, but it won’t catch any of these issues. For these cases you need something else: website monitoring. Website monitoring is the practice of automatically testing whether your site’s content is correct and its functionality is working. If anything does go wrong, your monitoring tool should emit alerts so you know right away.
Uptime monitoring answers one main question — is the server responding — and represents your site’s uptime as a percentage of total time measured. Website monitoring can answer more nuanced questions about the correctness of content and the site’s real usability. You can add tests beyond the availability of the root domain and check every important page with specific checks for content and functionality.
Tools like Datadog and New Relic give you observability into your infrastructure, whereas website monitoring tests from an external, end-user perspective, giving you a view of your site from the outside in. A website monitoring tool makes requests the way a real user would and evaluates the response for correctness and conformity to the configured expectations. It is not meant for checking internal operations of the server or other parts of your infrastructure: no traces, no logs, no memory/CPU metrics, no query performance or throughput measurements.
The advantage to the external scope of website monitoring is that it does not require any infrastructure access. This makes it lightweight to set up and easy to use. Website monitoring is best thought of as deepening your uptime monitoring and complementing your full-stack infrastructure observability tools.
Some monitoring and observability is done via automated scripts. This can give you insight on both internal and external operations, but it also means that those scripts must be maintained alongside any changes to the app implementation. A no-code, rule-based website monitoring tool like Testomato is more accessible for non-technical stakeholders because it is independent of the infrastructure and doesn’t require technical configuration to already be useful. You can just define the checks directly in the UI and your site is covered.
Uptime monitoring vs website monitoring
How are these two types of monitoring different? The key is in what each one actually checks.
It would be a simplification to say that uptime monitoring is just checking whether a site is up or down. More precisely, it’s monitoring how the server responds, which can also include an intermediate state: Warning/Timeout, which indicates degraded performance.
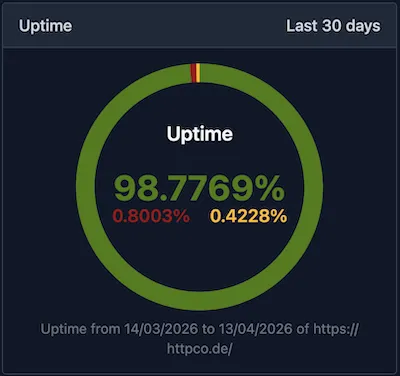
Uptime is the percentage of time your root URL was reachable — not timing out and not returning a server error. The uptime monitoring bot periodically (every 15 seconds in Testomato’s case) hits the root URL for your site and the result is classified as:
| Status | Condition |
|---|---|
| OK | HTTP status < 500 (anything that isn’t a server error) |
| Warning/Timeout | Request timed out |
| Error/Down | Network failure or HTTP 5xx |
So a page returning 404 Not Found is still considered “up” from the uptime monitor’s perspective. The system is only checking reachability, not correctness. Checking more specifically for the correctness of the response and its content, at a page level, is what individual tests are for — that is what website monitoring is for.
Website monitoring is a more active practice because you have to set the checks for the monitoring tool, so that it can run the tests against your assertions. You must also select which pages should be tested and how frequently to check (as often as every 5 minutes with Testomato). The shorter the interval, the sooner you know something is wrong.
Uptime monitoring reports are represented as a single percentage, but website monitoring reports take the form of individual incidents, based on the results of your individual tests, whether they were resolved and for how long they were failing.
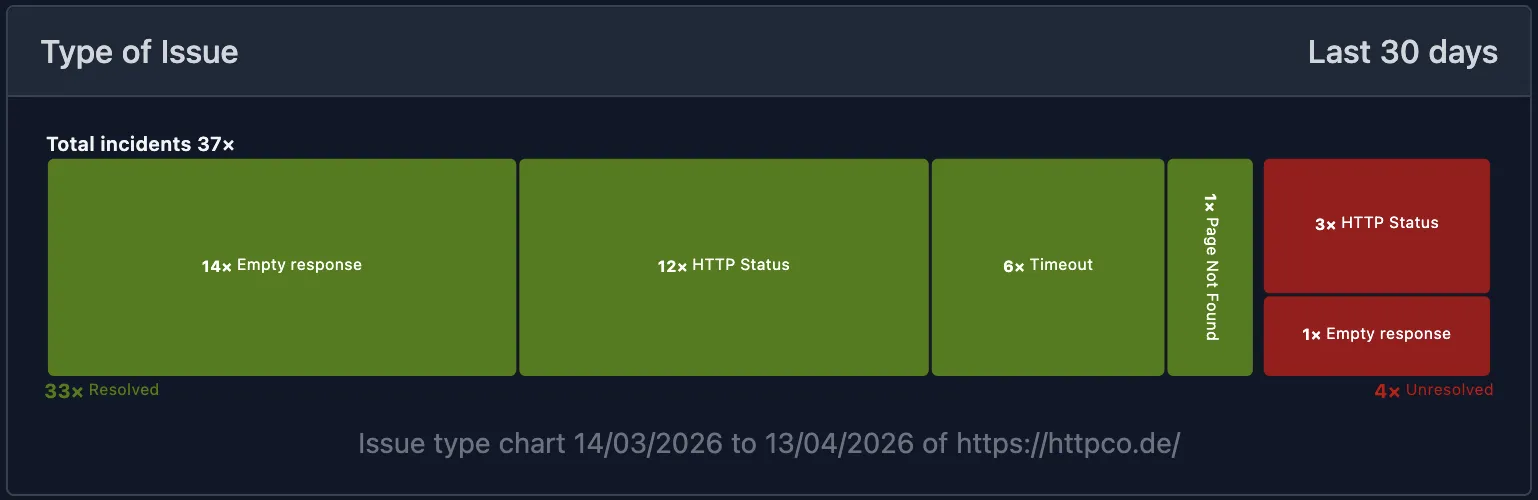
Website monitoring reports as individual incidents — by type, resolution status, and timeline.
What website monitoring checks
Content
By checking the text and HTML on the page, you can verify that the actual content the users see is visible and correct. But why would your content change or disappear?
Despite the protections provided by a well-designed deployment pipeline, it is always possible for incorrect content to make it to production. Even with a reliable system and a capable team, mistakes happen. Some likely scenarios include: a CMS update wipes a pricing block, a template change removes a form, or a third-party script serves the wrong component variant. In order to prevent such scenarios, you can test your content for correctness.
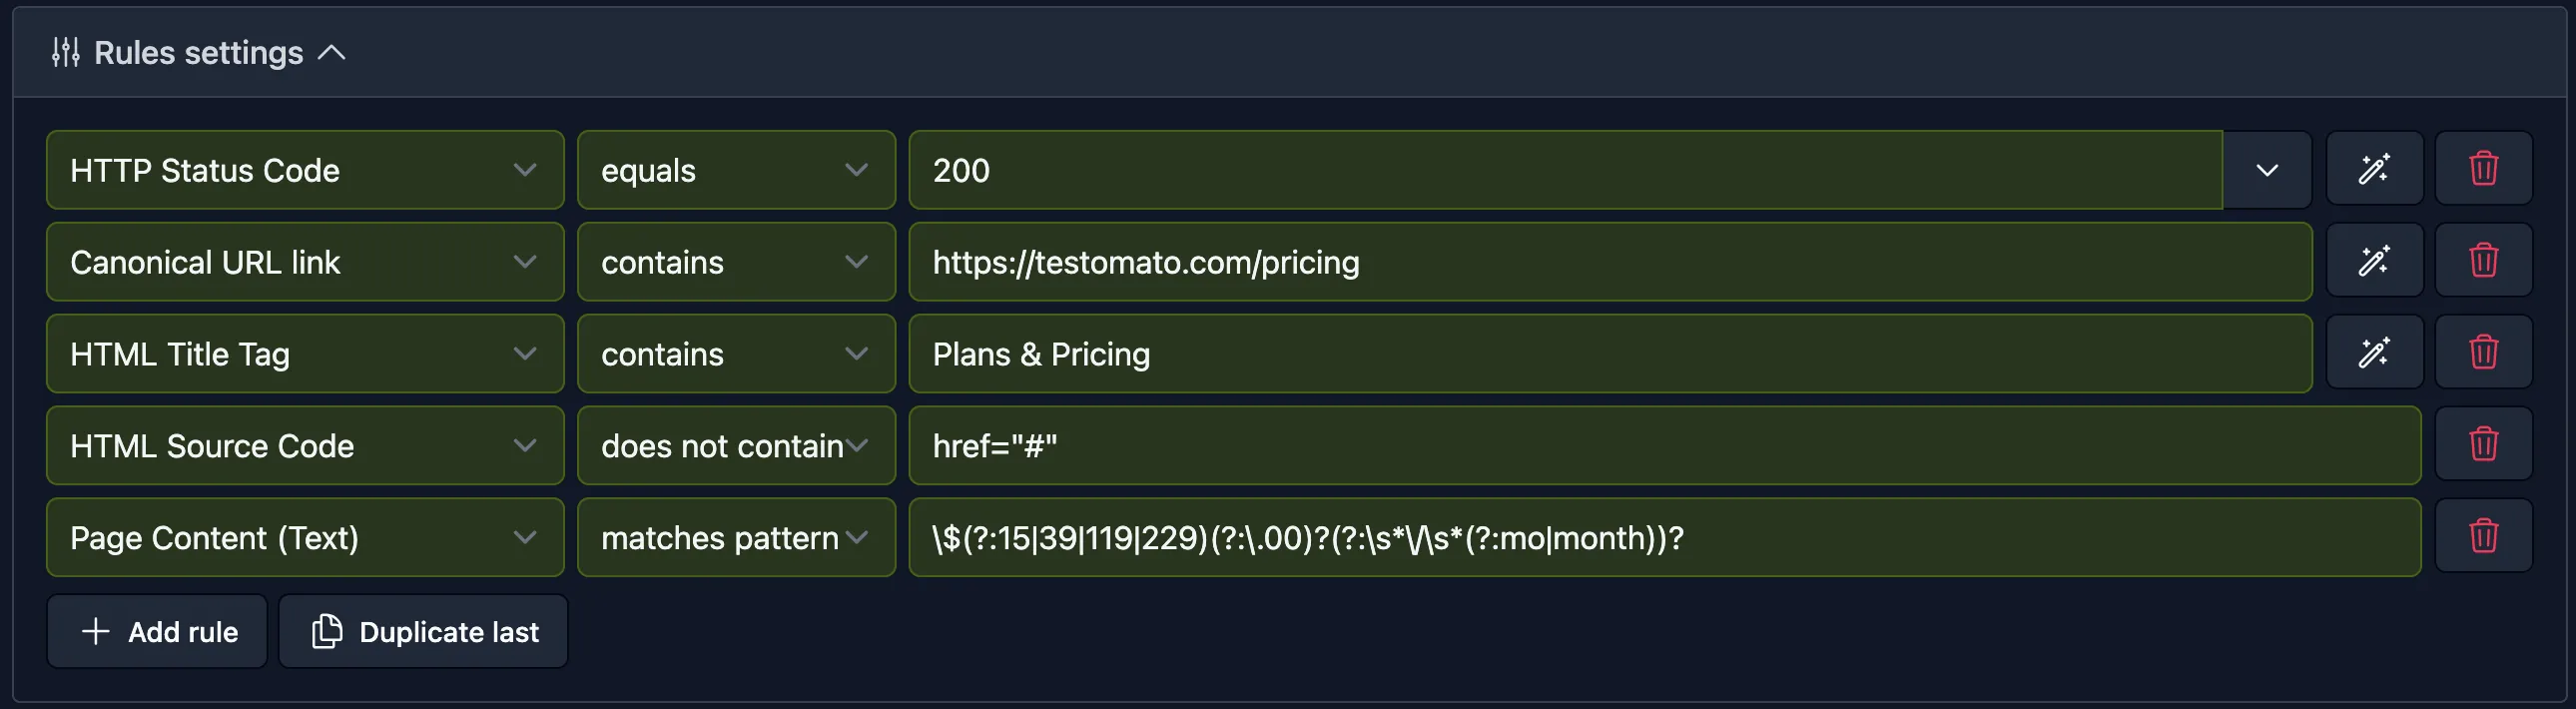
Most tools let you check either the raw HTML source or the rendered visible text, and match against a string or regular expression — useful when the content you need to verify isn’t a fixed literal string. In Testomato, these are the HTML Source Code and Page Content check types.
Meta tags
Some changes, like those to metadata, may only be discovered after a deployment. Website monitoring checks can help to protect your SEO from the harmful impacts of unexpected changes to metadata that break social previews or hurt click-through rate (CTR). Backlinko’s analysis of 4 million Google results found the #1 result position gets an average CTR of 27.6% while the top three results account for 54.4% of all clicks, so a title that changes from its intended copy can quietly suppress clicks without triggering any error. You can add tests for meta tags like title, meta description, Open Graph tags, and Twitter Card tags, to ensure that your links are being correctly and richly presented when they are shared via social channels.
Without og:image set, the shared link renders as a text-only card; with it, a rich preview.

Redirects
On top of verifying that the redirect destination and type are correct, you can also check for performance inefficiencies like redirect chains, which waste crawl budget, slow down the perceived speed of your site, and create canonicalization problems. Googlebot follows a maximum of 10 redirect hops, but chains that exceed that limit result in a destination URL getting excluded from indexing.
Since a correctly configured redirect will lead the client to a destination link that should usually return 200, if you want to check the redirect itself you may want to directly test both the destination URL and the redirect type. From an uptime monitoring perspective, a 301 is seen as a valid response (check passes). From a website monitoring perspective, however, adding a HTTP Redirect Location check to verify the type and destination enables you to catch misconfigurations that uptime monitoring would pass silently, such as a 302 that should be a 301 (preventing link equity from passing to the new URL).
Forms
Forms are a priority to monitor because they’re how users directly interact with your site. Testomato lets you submit forms automatically with real field values and assert the expected response: a confirmation message, a redirect, or a success status code. Some forms implement CSRF (cross-site request forgery) protection, which can interfere with automated submissions; see the help documentation on CSRF protection for how to handle it.
Automatic monitoring
Three other kinds of monitoring are worth knowing about, though they work differently from the website monitoring checks above since you don’t configure them manually.
Testomato’s automatic error monitoring scans every response body for common server errors. This covers PHP errors (Fatal, Warning, Parse, Notice), MySQL connection errors, WordPress “Error establishing a database connection”, XDebug/Tracy/Symfony errors, blank pages, and common error strings across Java, Ruby, JavaScript, and Python. Even though the server responds fine, the page may be showing an error instead of content.
SSL monitoring watches your certificates automatically. An expired cert triggers a “not secure” browser warning and in certain cases — such as on corporate networks with SSL inspection — can make the site completely inaccessible, even though the server is running fine. Domain mismatch, weak TLS version, and missing certificate chain have the same effect — each produces a browser error or block without the server returning anything unusual — so uptime monitoring won’t catch them. HTTPS is also a Google ranking signal, so a broken cert can hurt search visibility at the same time that it’s blocking users.
Response time monitoring tracks how long your pages take to load over time — TTFB, page load time, and latency trends. A site can be up and returning correct content and still be failing users if it’s slow. Page speed is a confirmed Google ranking factor and directly affects LCP (Largest Contentful Paint), one of the Core Web Vitals metrics. LCP should be under 2.5 seconds for 75% of real users — Google uses it in its core ranking systems — and only 39% of web pages currently pass the threshold. Monitoring catches regressions before the next crawl; by the time a slowdown shows up in Search Console, it’s already affecting rankings.
Why website monitoring matters
SEO
Downtime is obviously problematic for SEO, but problems with your content and functionality are no less impactful, especially since many of these issues can silently slip into production and remain there for some time if you aren’t testing and monitoring your site effectively. Some of the potential points of impact include crawlability, Core Web Vitals, CTR, and link equity.
Conversions
Website monitoring is important for conversions because broken forms mean losing leads and revenue. Broken functionality is frustrating and erodes user trust in your brand, especially for any interaction that involves payment or personal data. A site that doesn’t seem to work properly is not trustworthy for users. You can also lose user confidence if the information (prices, product info, availability) on your site is confusing, incorrect, or missing.
Accountability
When you monitor your site’s uptime and incidents, you are also creating a record of service delivery, which is useful for agencies reporting to clients, SaaS companies with SLAs, and owners who need to know what happened and when. A good website monitoring tool provides you with an incident history including duration, frequency, and timing. This data is not only useful for resolving incidents and preventing future ones through root cause analysis and subsequent improvements, but your website monitoring data can be used when making SLA breach claims against a hosting provider.
Start website monitoring
Your monitoring tool will have different defaults, but Testomato already enables uptime, SSL, error, and response time monitoring for new projects. New projects using the default template will automatically be configured with an HTTP Status Code equals 200 check for your homepage, favicon, robots.txt, and 404 page, as well as the 8 most significant pages linked from the homepage.
These defaults give you basic coverage for uptime, security, and performance to begin with, and after that you’ll want to manually add checks for your critical content, forms, and redirects.
If you’re new to website monitoring, here are a few things to prioritize first:
Check key pages
You should add content verification checks for your most important pages (homepage, pricing, contact/booking, checkout). Any page containing critical information or a form should have content checks beyond the basic HTTP 200 test. It’s a good idea to add content checks for anything that must stay correct: pricing, availability, legal copy, and form presence.
Check forms
Forms enable sign-ups and transactions, so testing them is a priority. Add a form submission check and assert the expected response — a confirmation message, a success status, or a redirect to the right destination.
Check redirects
Redirect checks are up to your discretion, but for critical resources that have been moved it is generally worth it to add tests for them as well. You don’t need to add a test for every redirect, just the ones with the most link equity at stake, or during major migrations that involve URL restructuring. See how to add a redirect check in the help docs.
Alerts
After you’ve designed and added your website monitoring checks, you can also configure alerts to fire notifications to your channel(s) of choice and according to your preferences about the severity of the incident.
A good monitoring tool alerts on status changes, not on every failed check — otherwise adding or modifying a check would flood you with notifications.
Having some level of control over where you receive notifications and in what cases is just as important as the website checks themselves, because with an automated system you want to be notified quickly for what actually matters. For a deeper look at alert routing and avoiding alert fatigue, see Alerts and Avoiding Alert Fatigue.
Conclusion
While many aspects of your site, like uptime and response time monitoring, can be automatically checked, website monitoring is active — it requires you to define what correct looks like for your content and functionality.
Start Website Monitoring for Free
14-day free trial. No credit card required.

Written by
Rudi Kraeher