Guide to Response Time Monitoring
As computing technology continually advances, the concerns of the humans who use it remain stable. People want things to be fast, reliable, and easy to use. People also want their technology to give them agency so that they feel in control.
Internet technology has been developed to help us distribute information, and access to that information should not be impeded by confusing language and interfaces or sluggish response times.
Although network speeds and computing power have improved, the psychological limits on response time are the same ones researchers measured in the late 1960s and Jakob Nielsen popularized in the 1990s:
- 0.1 seconds feels instantaneous
- 1 second is a noticeable delay, but thought stays on track and the user still feels in control
- 10 seconds is the limit of attention — beyond it, the mind drifts to other things
These thresholds have been public knowledge for decades, yet most websites still do not manage to provide the quality of experience that these limits define. In the HTTP Archive’s 2025 Web Almanac, only 48% of mobile sites and 56% of desktop sites passed all three of Google’s Core Web Vitals, the closest thing the modern web has to an agreed measure of those perception limits.
There are real technical constraints that make achieving Nielsen’s response time limits a challenge. Even as tech has improved, so too have user expectations for the richness of web content and interactions — median page weight has grown nearly 6x on desktop since 2011 and over 13x on mobile — making a consistent, high quality experience difficult to deliver in practice. If keeping a site fast were as simple as following a checklist of universal, actionable bullet points, the numbers would look very different.
You will find plenty of online content with suggestions about what could be going wrong and how to improve your response time. The truth is that there are too many technical factors for any general list of issues and fixes to be useful. You have to get specific about your own system and use measurements to narrow down the possibilities until you find the bottleneck. This is detective work: measuring, comparing, and looking for patterns. Generic advice like “optimize your database queries” doesn’t help you do it. What helps is knowing, from your own data, where in your stack the slowdowns happen, under what conditions, and what you can realistically do about them. So this is not a “how to fix latency” article, because no honest article can be.
What we can do here is give you a foundational understanding from which to build your optimization plan. This article explains what response time is, how it is measured across the phases of a web request, how to read and start analyzing the data your monitoring collects, and why automating that measurement is worth it.
What is response time?
Response time is the time between a client making a request to a service and receiving the full response, usually measured in milliseconds (ms). For web technologies, it includes not only the time the server needs to process the request but also the transmission time over the network. Together, the initial connection, request, waiting, and content download phases make up the total response time. We discuss each phase in detail below.
The response time measures the difference between two moments in the flow of data between client and server:
- Start: the moment the client initiates the connection to the server
- End: the moment the last bit of data is received from the server by the client
A lot of things can happen between those two moments and not every step will take equal time. Before we get into the details of the full request cycle, we should first distinguish response time from a similar set of concepts related to web performance: Google’s Core Web Vitals.
How does response time relate to Core Web Vitals?
Core Web Vitals and response time are both topics related to measuring and improving site performance and user experiences on the web. However, there are important differences in what they measure and how to use the metrics in managing and maintaining your site. Where Nielsen’s thresholds describe pure human perception, Google’s Core Web Vitals balance those limits against achievability, setting targets that a realistic share of the web can actually meet.
Core Web Vitals
Core Web Vitals are three metrics Google uses to measure the quality of a page’s user experience: Largest Contentful Paint (LCP), which tracks loading; Interaction to Next Paint (INP), which tracks responsiveness to input; and Cumulative Layout Shift (CLS), which tracks visual stability. They are measured from real users at the 75th percentile and are used as a search ranking signal. These are frontend, user-experience metrics — they describe what the visitor sees and feels in the browser.
For the two Core Web Vitals related to response time, a page is considered good when the main content appears quickly (LCP) and the page responds to clicks or taps almost immediately (INP). Cumulative Layout Shift (CLS) is also a Core Web Vital, but as a visual stability measure it has no direct relationship to response time.
| Metric | Good | Needs improvement | Poor |
|---|---|---|---|
| LCP | ≤ 2.5 s | 2.5–4 s | > 4 s |
| INP | ≤ 200 ms | 200–500 ms | > 500 ms |
Although it is a supplemental metric, not a Core Web Vital, discussions of website performance in Google documentation and elsewhere often refer to Time to First Byte (TTFB). This metric overlaps with response time but is not synonymous with it, so it is worth explaining the difference since it is so prominent in popular literature on website speed.
TTFB
TTFB is the time from the start of navigation until the client receives the first byte of the response. It covers everything before the response body starts arriving: redirects, DNS, connection setup, and server processing. In our breakdown of the request lifecycle below, the “Waiting” phase — the server processing time — is the largest and most controllable slice of TTFB, but the two are not identical. The recommended target is 0.8 seconds or less, with anything over 1.8 seconds considered poor.
TTFB matters for Core Web Vitals because it comes first. Nothing can render in the browser until the first byte arrives, so a slow TTFB puts a ceiling on how fast LCP can possibly be. This is why the two are complementary rather than interchangeable: Core Web Vitals (measured with a tool like PageSpeed Insights) tell you about the frontend experience, while response time monitoring tells you about server and network responsiveness. Read together, they help you locate whether a bottleneck lives on the backend or the frontend — and response time monitoring is what gives you continuous visibility into the server side. The request lifecycle section below includes a diagram mapping TTFB against the total response time.
What is a “good” response time?
There is no single number that counts as a “good” response time. What counts as good depends on your site, your users, and which pages you are measuring. Rather than chasing an arbitrary target, the more useful approach is to establish your own baseline from your monitoring data and then judge it against your specific context.
Here are some questions to ask yourself to help clarify priorities when you are trying to optimize your quality of service:
| Ask yourself | Why it matters |
|---|---|
| What kind of business or site do you manage? | The business model decides which parts of the site must be fastest and which can be slower without causing visitor bounce or failed conversions |
| What interactions or content are most important and prominent? | Large, high quality images, live user-generated data, static text, and heavy database reads and writes all have different speed profiles |
| Who are your primary users? | Their devices — mobile, wireless laptops, hardwired desktops — and their expectations set the bar you are judged against |
The answers to these questions will help orient your focus when you work on performance. It is worth answering these questions thoroughly because you will not have full control over every phase of a user’s journey. Realistically, there will always be some latency — a 0ms response time utopia is a fantasy.
Why does having a good response time matter?
Speed is not just a technical nicety — it maps directly to revenue. A Google and Deloitte study of 37 brands across 30 million sessions found that a mere 0.1-second improvement in load speed lifted conversion rates by 8.4% for retail sites and 10.1% for travel sites. The effect compounds deeper in the funnel: for luxury retailers, the same speed gain drove a 40% increase in shoppers progressing to add-to-basket. This is what happens when you remove friction from the exact moment a user decides whether to stay or leave.
Because response time sets the floor under everything the browser renders, improving it shows up in the metrics Google now ranks on. Vodafone improved its Largest Contentful Paint by 31% and closed 8% more sales as a result. LCP can only be as fast as the first byte that precedes it, so a slow server response hurts both your search rankings and your conversion rate at once.
What makes a site slow?
There are a lot of things that can degrade your site’s responsiveness:
- Server overload
- Network latency
- Poor caching
- Unoptimized media files
- Bloated third-party scripts
- No load balancing
This list is just a small sample of possible issues. Each of these issues can be associated with certain phases in the web request journey — an overloaded server will most likely show up in your response times as longer “Waiting” time. The only way to know is to look closer at the response times, narrowing things down so that you can identify the bottleneck.
It’s less useful to generate a list of what could be the source of website slowness than it is to use historical response time data — gathered with your monitoring software — to reduce the number of possible problems, ideally leaving only one high-leverage area on which to focus your optimization efforts.
How can I improve my response time?
Unfortunately, this is not a question we can answer directly. With such a variety of possible reasons why your site could be slow, and without looking at your data and infrastructure, a list of “what to do” would be little more than a checklist of things that could be wrong. Acting on guesses is usually just a waste of resources.
You’ll want hard data that can point you to the root problem so that you can fix it properly. This is where automatic response time monitoring helps: it gives you real trends to analyze so you can make informed (non-vibes-based) decisions. More importantly, those trends can point you towards what to fix or improve before you have incidents that negatively impact your users.
Response time monitoring with a tool like Testomato is in this sense diagnostic and preventative, rather than corrective.
What is response time monitoring?
Response time monitoring is the automatic, regular measurement of a system’s response time.
Using automated software that regularly checks and records the responsiveness of a tested system enables a user to track patterns in the response time over a longer period, including the minimum, maximum, and average response times.
Remember that response time measurement begins with the initial connection (connectionStart) and ends when the
last bit of data is received by the client (lastRead). In monitoring processes, we calculate this time as a
simple subtraction between the two timestamps:
lastRead - connectionStart = totalResponseTimeThis simple formula produces the total response time, but there are several steps in the journey
of a request that can impact the final total. Let’s look at what happens between connectionStart
and lastRead.
What happens during a web request?
The full lifecycle of the request includes several phases:
| Phase | What it measures |
|---|---|
| DNS lookup | Hostname → IP resolution |
| Initial connection | TCP handshake (+ TLS for HTTPS) |
| SSL | TLS negotiation only (sub-span of Initial connection) |
| Request | Sending the HTTP request |
| Waiting | Server processing |
| Content download | Receiving full response body |
| Total | Everything from TCP open to last byte received |
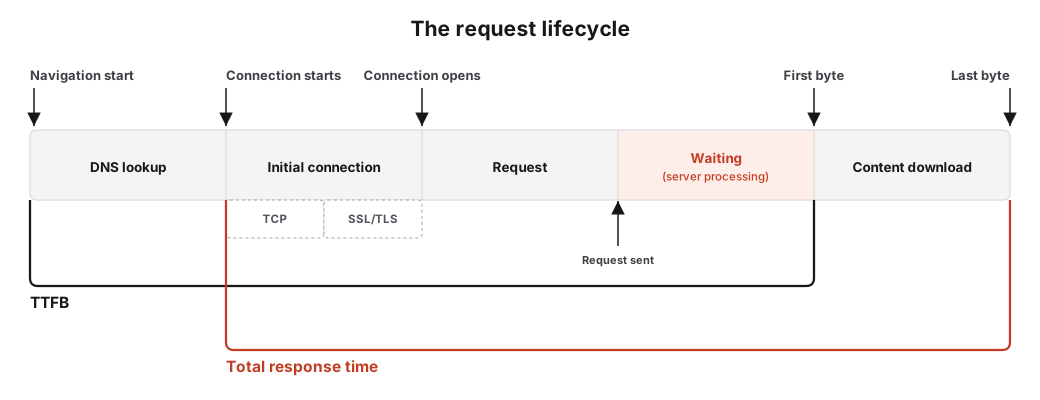 TTFB ends at the first byte and includes DNS. Testomato’s total response time excludes DNS but includes
the full content download.
TTFB ends at the first byte and includes DNS. Testomato’s total response time excludes DNS but includes
the full content download.
DNS lookup
Before any connection can be made, the client needs to know where to connect, so it queries a Domain Name System (DNS) resolver to get the IP address for the requested hostname.
Since this phase happens outside the connection between the client and the server, the DNS lookup time is not counted in the total response time. That matters because if DNS is slow, users could be experiencing slow service that your total response time doesn’t show. That is why it is important to account for real user experience when you are evaluating your site responsiveness.
If everything else in the response is green, DNS is the next place to look for latency, since it happens before the connection starts. Our DNS checker tool can help you verify the DNS records behind that lookup are configured correctly.
Initial connection
This is the TCP handshake — the moment the client and server establish a live connection before any data is exchanged. It happens in three steps:
- The client sends a connection request
- The server acknowledges the request
- The client confirms
After the three-part handshake is complete, the connection is established and the client can send the actual request.
This phase is where you pay the cost of network distance. The greater the distance between the client and server, the further signals have to travel, extending the connection time regardless of how fast the server itself is.
SSL
This phase overlaps with the initial connection phase — it is not sequential. The security protocol operations performed while establishing the connection are distinct, so it is worth isolating the Secure Sockets Layer (SSL) time from the broader initial connection process.
In the Testomato API we call this phase “SSL time” as a shorthand, but it really includes the full TLS negotiation, verifying SSL certificates and agreeing on the terms of encryption for the connection. You can check a certificate’s validity and expiry directly with our free SSL checker.
Since SSL verification happens during the initial connection phase, along with the TCP handshake, initial connection time includes the SSL time. Looking at SSL time individually gives you more precise information about how long the TLS negotiation took while establishing the connection.
Request
Once the connection is established and encryption is in place, the client sends the HTTP request to the server. Under normal conditions this should be a very short phase, as a standard GET request will only include the method, URL, and headers. This is a small amount of data and most of the time will be spent elsewhere rather than in making the request.
Waiting
The client is idle during this phase while it waits for the server to respond. During this phase the backend processes the request — including making any of its own requests, if necessary. Typical actions include database queries, application logic, cache lookups, and any other work the server has to do before it can send back a response. This is the server-side portion of TTFB, which we cover in more detail above.
It is also the phase that developers typically have the most control over, but again this all depends on your individual infrastructure. If you control the server and have long waiting times, you may be in a position to do more about it, unlike things outside your control, like delays caused by network transit.
Content download
In this phase the response body arrives, all at once or in streamed chunks. After the first byte lands, the client reads until there is nothing left. For a typical website GET request that means the page markup; for a RESTful API it’s the JSON payload (or whatever format the API provides).
Download time scales with two things: the size of the response and the available bandwidth. However fast the server processed the request, a large payload on a slow connection will still drag out the total response time.
You cannot control the raw network speed between your server and your users, but you can send less data more efficiently. And if your users consistently see long download times, that is a signal you can act on with infrastructure decisions, such as using a better-located CDN.
Remember: each of these phases takes a different amount of time, and you do not have equal control over all of them — in some cases, none. Treat them as diagnostics that point you towards the bottleneck in your response times.
How does Testomato measure response time?
We measure response time by sending an HTTP GET request to the main project URL of the monitored site at scheduled intervals, parsing the response, and recording the times so they can be aggregated in your reports. This is the basic check for every Testomato project, and it collects uptime and SSL certificate expiry data alongside the response time measurements.
Our Testomatobot establishes a secure connection (verifying the SSL certificate) before sending the GET request. If the project URL returns a 301 or 302, it follows up to 21 redirect hops and includes the full elapsed time it took to reach the destination URL in the total response time.
You can configure how often Testomatobot checks the site — every 15, 30, or 60 seconds — and the readings from these checks get bucketed into 60-second windows. With a frequent check interval, like every 15 seconds, your site will have multiple readings per window. To reduce those readings to a single, reliable figure, we sort the times and use the median value as the final total for each window.
When you filter your report over longer periods, multiple response times are averaged together to construct the response time chart, so you can choose how much granularity you need when reading your data.
How to read response time data
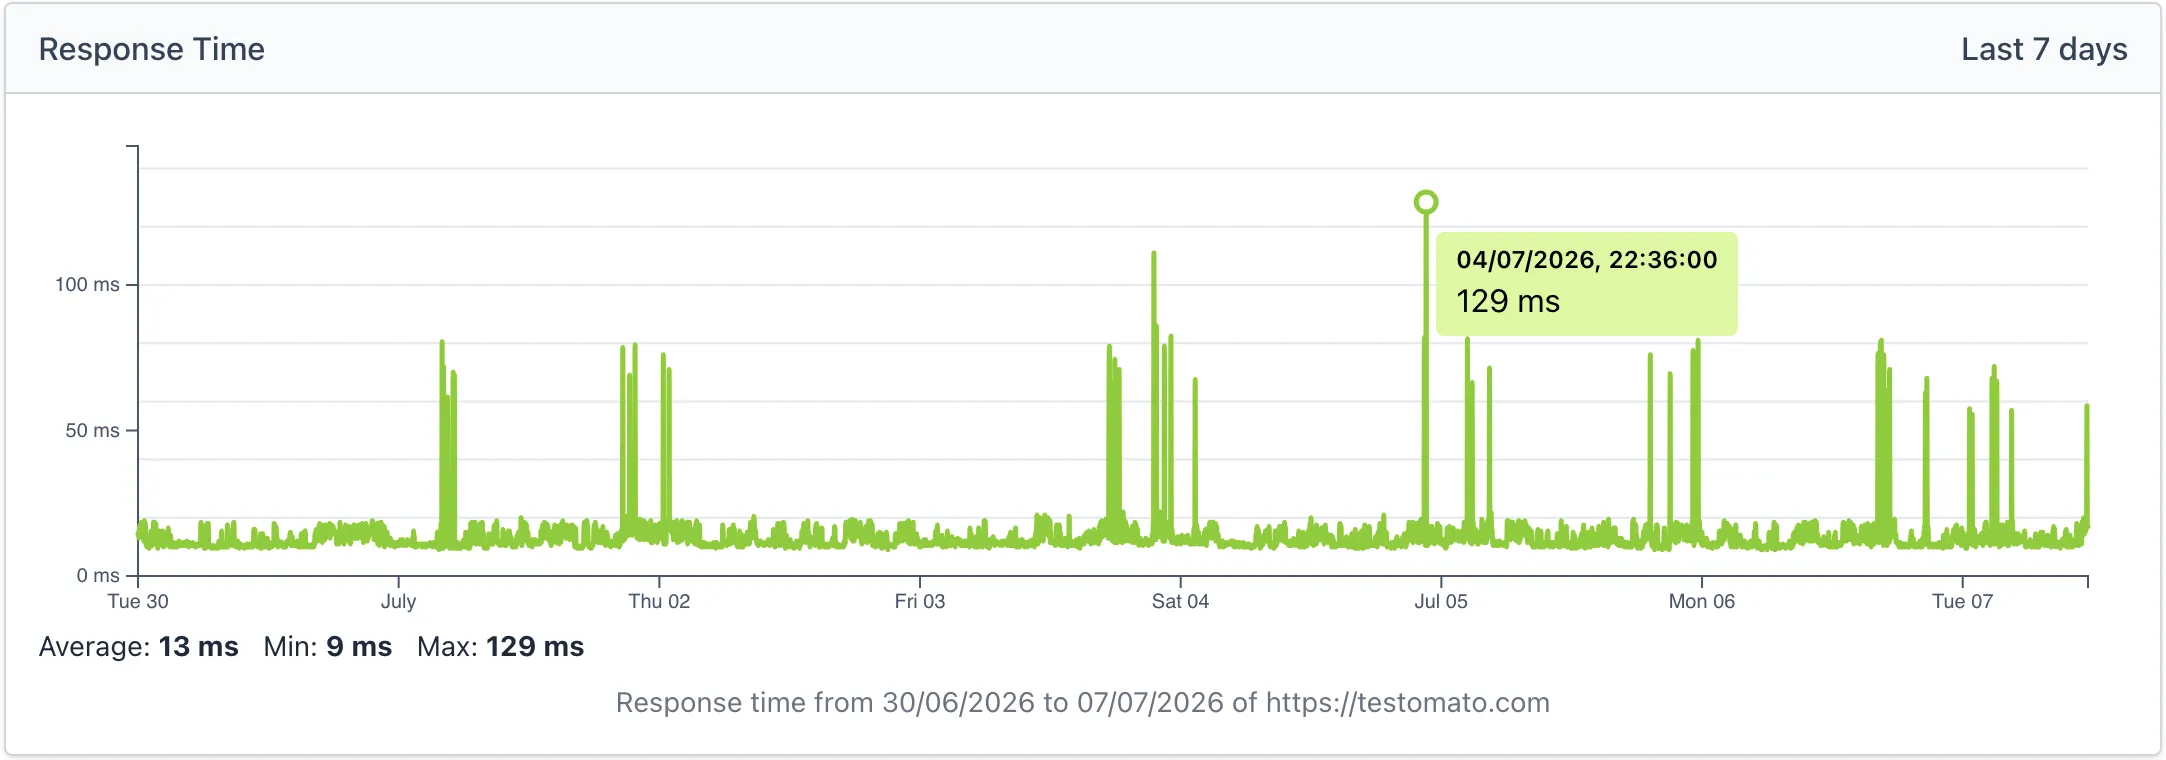
In Testomato, response time is measured against the main project URL. You can see the maximum, minimum, and average response time in milliseconds over different periods of time as a line graph.
Don’t read too much into single data points and extreme outliers. Infrequent blips of low responsiveness in the middle of the night do not necessarily indicate a problem worth solving. The more practical approach is to look for patterns in context.
Establishing baseline and priorities
Before you even begin analyzing the data, you should have some baseline performance readings and realistic expectations established. You’ll want to map out the critical pages and functionality for your site. If you have set up some basic website monitoring checks previously, you may have already done this mapping.
Make sure you are clear about:
- Which pages matter the most
- Which pages are the most sensitive to slowness
- The minimum response time you need to provide a quality user experience
Not every page requires the same level of responsiveness. Delays on critical actions like logging in or loading a product detail page will cause greater friction for users than some background operation that is expected to take time (e.g., importing contacts from a csv). The business use-case questions we covered earlier will help you clarify your page priorities.
Any response time analysis you do will benefit from contextualizing your response times within the specific actions and views that actually matter to your users.
Analyzing spikes
At first glance, the most obvious responsiveness issues you’ll want to look at are latency spikes, but do not rush to escalate every individual spike. A lot of things can cause a spike and some of those may not even be in your control.
What we first want to look for are recurring patterns of high latency. That data can help point you towards the common factors — certain time periods, events, seasons, locations, etc. — that may be contributing to or directly causing those slowdowns. Isolated, individual spikes may or may not be important, but recurring ones that follow a pattern give us useful signals to act on.
If you do notice regular or semi-regular spikes that are severe enough to be felt by real users, you should look closer to figure out where in the request lifecycle the biggest slowdowns are happening. Before you associate the spikes with any changes, like a deployment or plugin update, you first need to know more specifically where the time is being spent. You can do this by calling the Testomato API to get more details about the response times of the individual phases of the request.
Analyzing trends
The other thing you will want to look for in your response time monitoring data is a consistent curve upward. Steadily increasing response times are worth investigating so you can plan accordingly.
This is why having continuous, automatic monitoring is so powerful. It helps you see where things are going so that you can act before slowdowns or, worse, downtime impacts your users and your business.
How to monitor response time
Response time monitoring is a built-in feature of every Testomato project. Start a new project and we immediately begin monitoring response time, along with uptime and SSL certificate expiry.
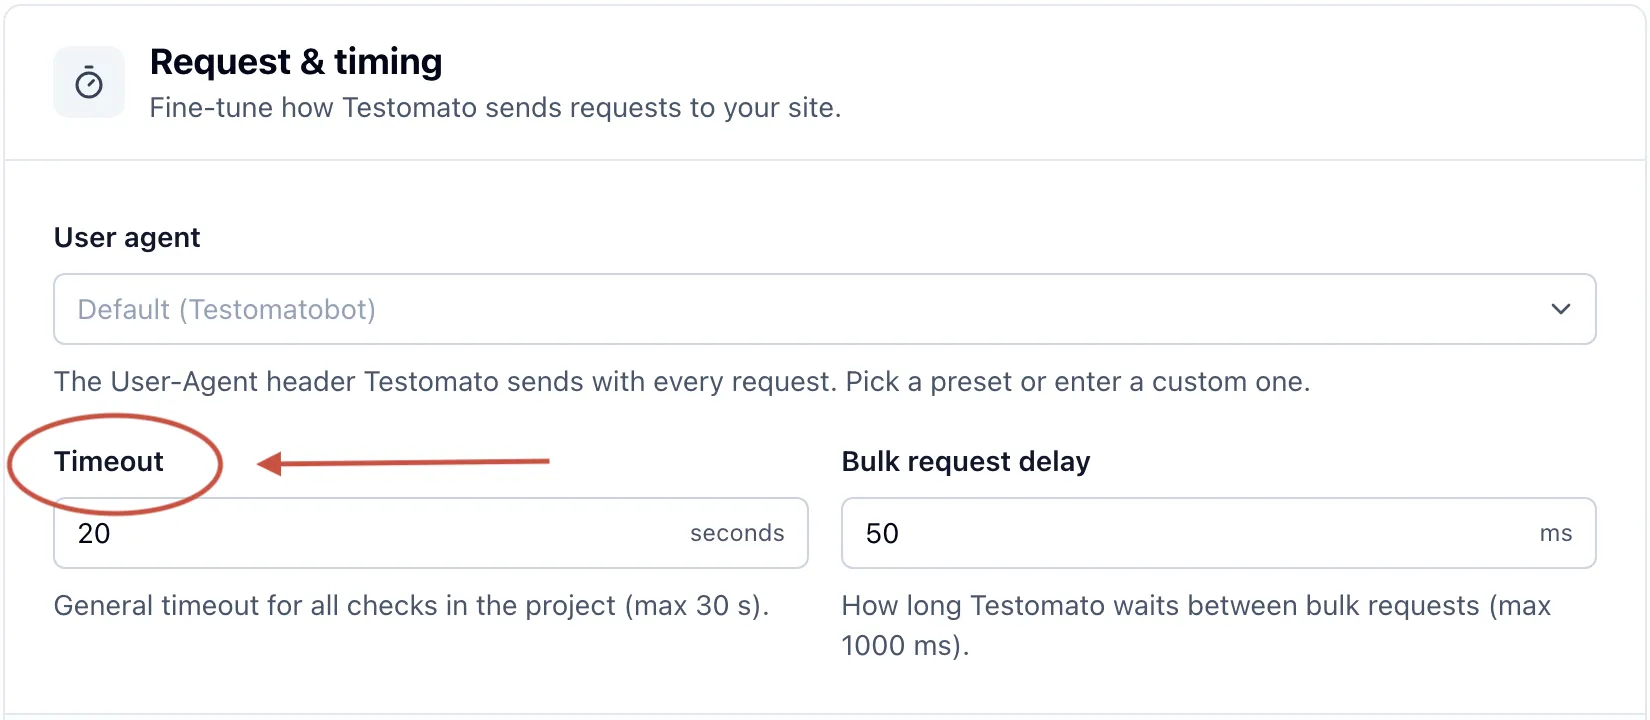
Besides reading the reports, what you can do is adjust your settings for timeout thresholds and for notifications to receive alerts. You can also use the Testomato API to get response times for specific phases in the request lifecycle, such as the content download time or waiting time.
Timeouts
You can set the threshold for a general timeout for all the checks in your project. This gives you control over how responsive you really need your site to be before Testomato will treat the slow response as an error.
Alerting
You can also control whether you get notified for early/soft failures, like timeouts, or only for hard errors and downtime incidents.
Knowing more sooner is not always what you want — some services can have an acceptable level of slower service without producing a harmful (or even noticeable) issue for your users.
If your alerting is too sensitive, you risk flooding your notification channels with noise that creates alert fatigue and distracts from the more serious incidents that require your attention.
Testomato API
We provide a public API endpoint, /responseTimes,
which gives you access to the times for the individual phases of the full request
in addition to the total response time displayed in the app. See the request lifecycle
section above for an explanation of each phase.
  {
    "responseDate": "2026-07-07T00:00:00+00:00",
    "dnsLookupTime": 1,
    "initialConnectionTime": 1,
    "sslTime": 14,
    "requestTime": 0,
    "waitingTime": 1,
    "contentDownloadTime": 2,
    "totalResponseTime": 18
  },
Excerpt from a /responseTimes response, with all phase times and the total in milliseconds.
You can use our public API when you want more insight into where the majority of time is spent during requests while diagnosing your site’s response times. You can also push the more detailed response time data to your analytics system.
Monitoring your response time with Testomato arms you with real data to take action before your users experience downtime or service degradation.
Start monitoring your response times with Testomato
14-day free trial. No credit card required.

Written by
Rudi Kraeher